Methodology and objectives of the analysis in relation to real case studies
The distribution of thermal and cooling energy within complex facilities such as industrial plants, production sites, and medium to large civil use buildings (such as schools, hospitals, RSAs, etc.) represents an aspect that is often underestimated in the context of plant operation, but is of fundamental importance for the proper functioning of the systems serving the building or production process.
Often, in fact, when faced with critical issues in the operation of facilities, the solution is sought in enhancing thermal or cooling power generation to meet the energy needs of buildings. For example, when faced with difficulties in cooling a specific area of the site, it is assumed that the cause lies in the fact that the installed chiller units are unable to make adequate cooling capacity available to the plant.
Why analyze the distribution system of heat transfer fluids
The heat transfer fluid distribution system is responsible for the proper transfer of energy from the generation section to the utilities. It follows, then, that often the critical issues encountered in the operation of facilities are not solely attributable to generation, but also to the way energy is distributed in the building.
Particularly in buildings with a long history behind them, successive plant modifications over time have gradually degraded the effectiveness of heat transfer fluid distribution in the plant. Thus, we have regions of the system characterized by inadequate fluid velocities in the pipes, distribution patterns that are no longer linear, where the direction of the fluid can reverse as the demand for energy from the utilities changes.
What are the consequences of a suboptimal distribution system?
In the presence of a suboptimal distribution system, discrepancies are created between the flow rate of the heat transfer fluid required by the utilities and that actually supplied. For example, in a hydronic system, a utility disadvantaged by the distribution system will receive less water flow than it actually needs. Conversely, if a utility is favored by the distribution, the utility will be supplied with a higher port of water than established.
Under such conditions, utilities will operate in an operating regime that deviates from design conditions. The effects range from reduced efficiency in energy use to the inability to ensure proper air conditioning of rooms or operation of process utilities.
Purpose of power distribution system analysis.
In order to resolve critical issues in plant operation, when there are problems with thermal energy use at the sites under study, it is essential to verify the actual operating conditions of the plant. This analysis then allows for the identification of the causes of critical plant issues, such as:
- Nonlinear distribution structure with the possibility of flow reversal;
- Pipe sections characterized by excessive fluid distribution velocity, resulting in high pressure drops;
- Degree of passive network balancing: presence of utilities disadvantaged or favored by distribution;
- Checking the point of operation of the pumps serving the distribution system.
Ways of developing the analysis
The study begins with the acquisition of distribution network data, such as the list of utilities, mechanical components such as pumps and control systems, schematics and floor plans of the network.
We then proceed by making a calculation model of the network, from which the pressure losses of each utility under nominal operating conditions are determined. From this first step, an overview of the degree of network mal-distribution is obtained, identifying what might be the utilities most disadvantaged or favored by the heat transfer fluid supply.
At a later stage, the equilibrium point reached by the plant under actual operating conditions is determined. Thus, the flow rate of heat transfer fluid actually supplied to the utilities is obtained. By comparing this data with the theoretical flow rate required by the utilities, the effectiveness of the distribution system can be evaluated.
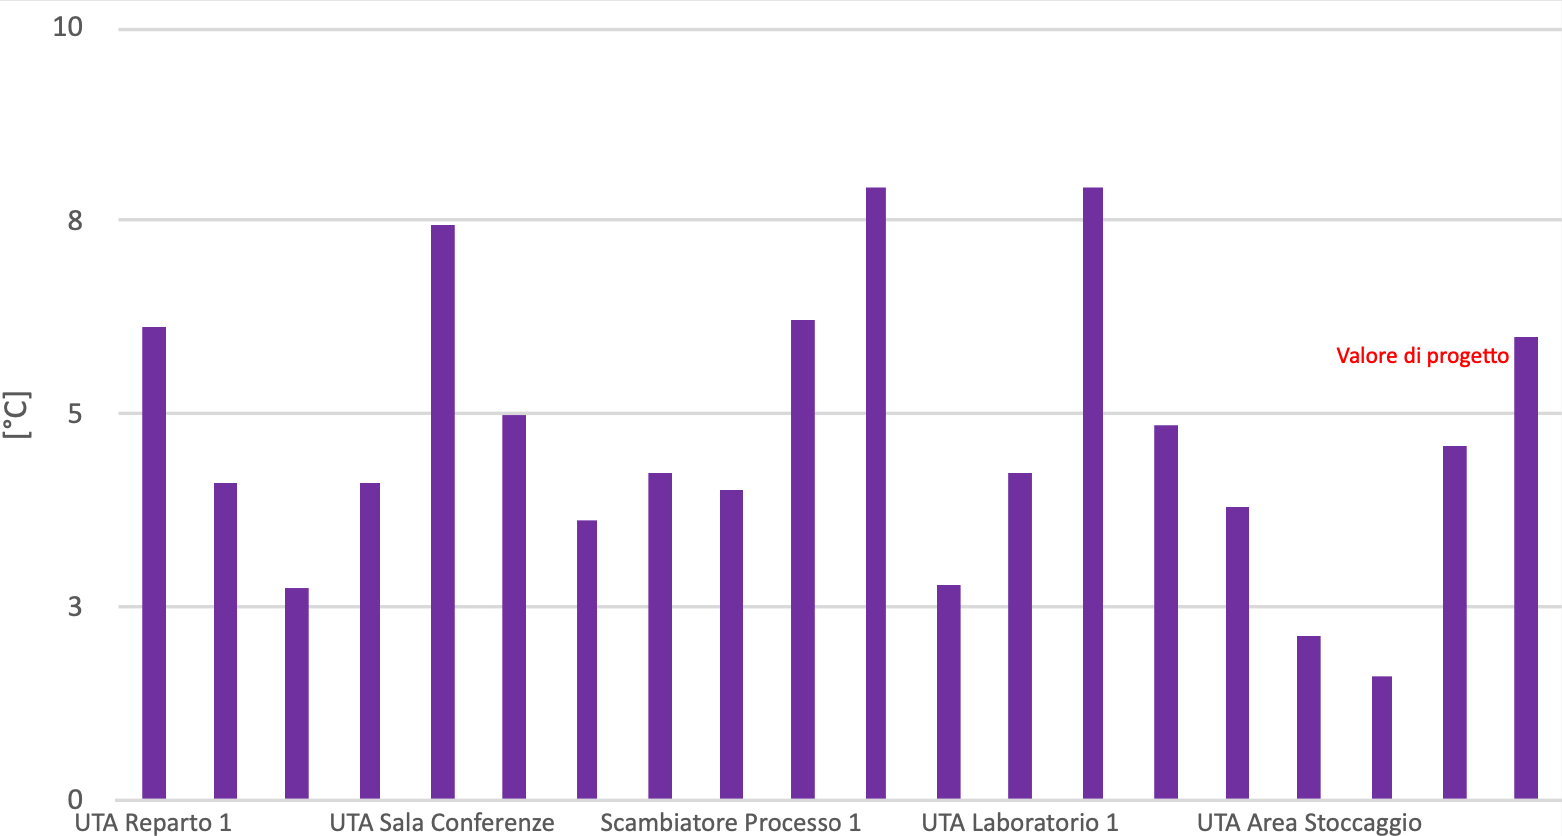
From the results thus obtained, the temperature difference of the heat transfer fluid straddling each utility can be determined. This figure, compared with the relevant design value, makes it possible to determine whether any criticalities are present in the operation of the utilities served by the distribution network.
The process described above can be repeated in order to simulate the behavior of the distribution network as operating conditions change, or to assess in advance the effect of any corrective actions to be taken on the system.
Real case study: pharmaceutical company in the Province of Milan
The methodology described in the previous paragraphs was applied to optimize the distribution of chilled water serving the air conditioning and process utilities of the manufacturing plant of a pharmaceutical company in the Province of Milan.
The Customer complained of difficulties in ensuring the proper supply of chilled water to some Air Handling Units (AHUs) connected to the chilled water network. In particular, the Client observed that some utilities were operating with a temperature difference straddling the heat exchangers that was significantly higher than the design value (equal to 5°C).
The study made it possible to determine the pressure drop at the utilities (Chart 1) and the comparison of the flow rate of water actually supplied to the utilities with respect to the required value (Chart 2), resulting in the deviation of the thermal jump at the utilities from the nominal value of 5°C (Chart 3).
The analysis revealed that some of the lines leaving the Refrigeration Plant were transferring flow rates that were excessive compared to the diameter of the pipes. The same situation was also found on some secondary branches. From the analysis conducted, the following corrective actions were implemented:
- Adaptation of some sections of pipeline undersized with respect to the power required by the section they serve;
- Installation of a new pumping unit to serve a specific area of the plant.
Chart 1. Pressure losses to utilities at rated flow rate
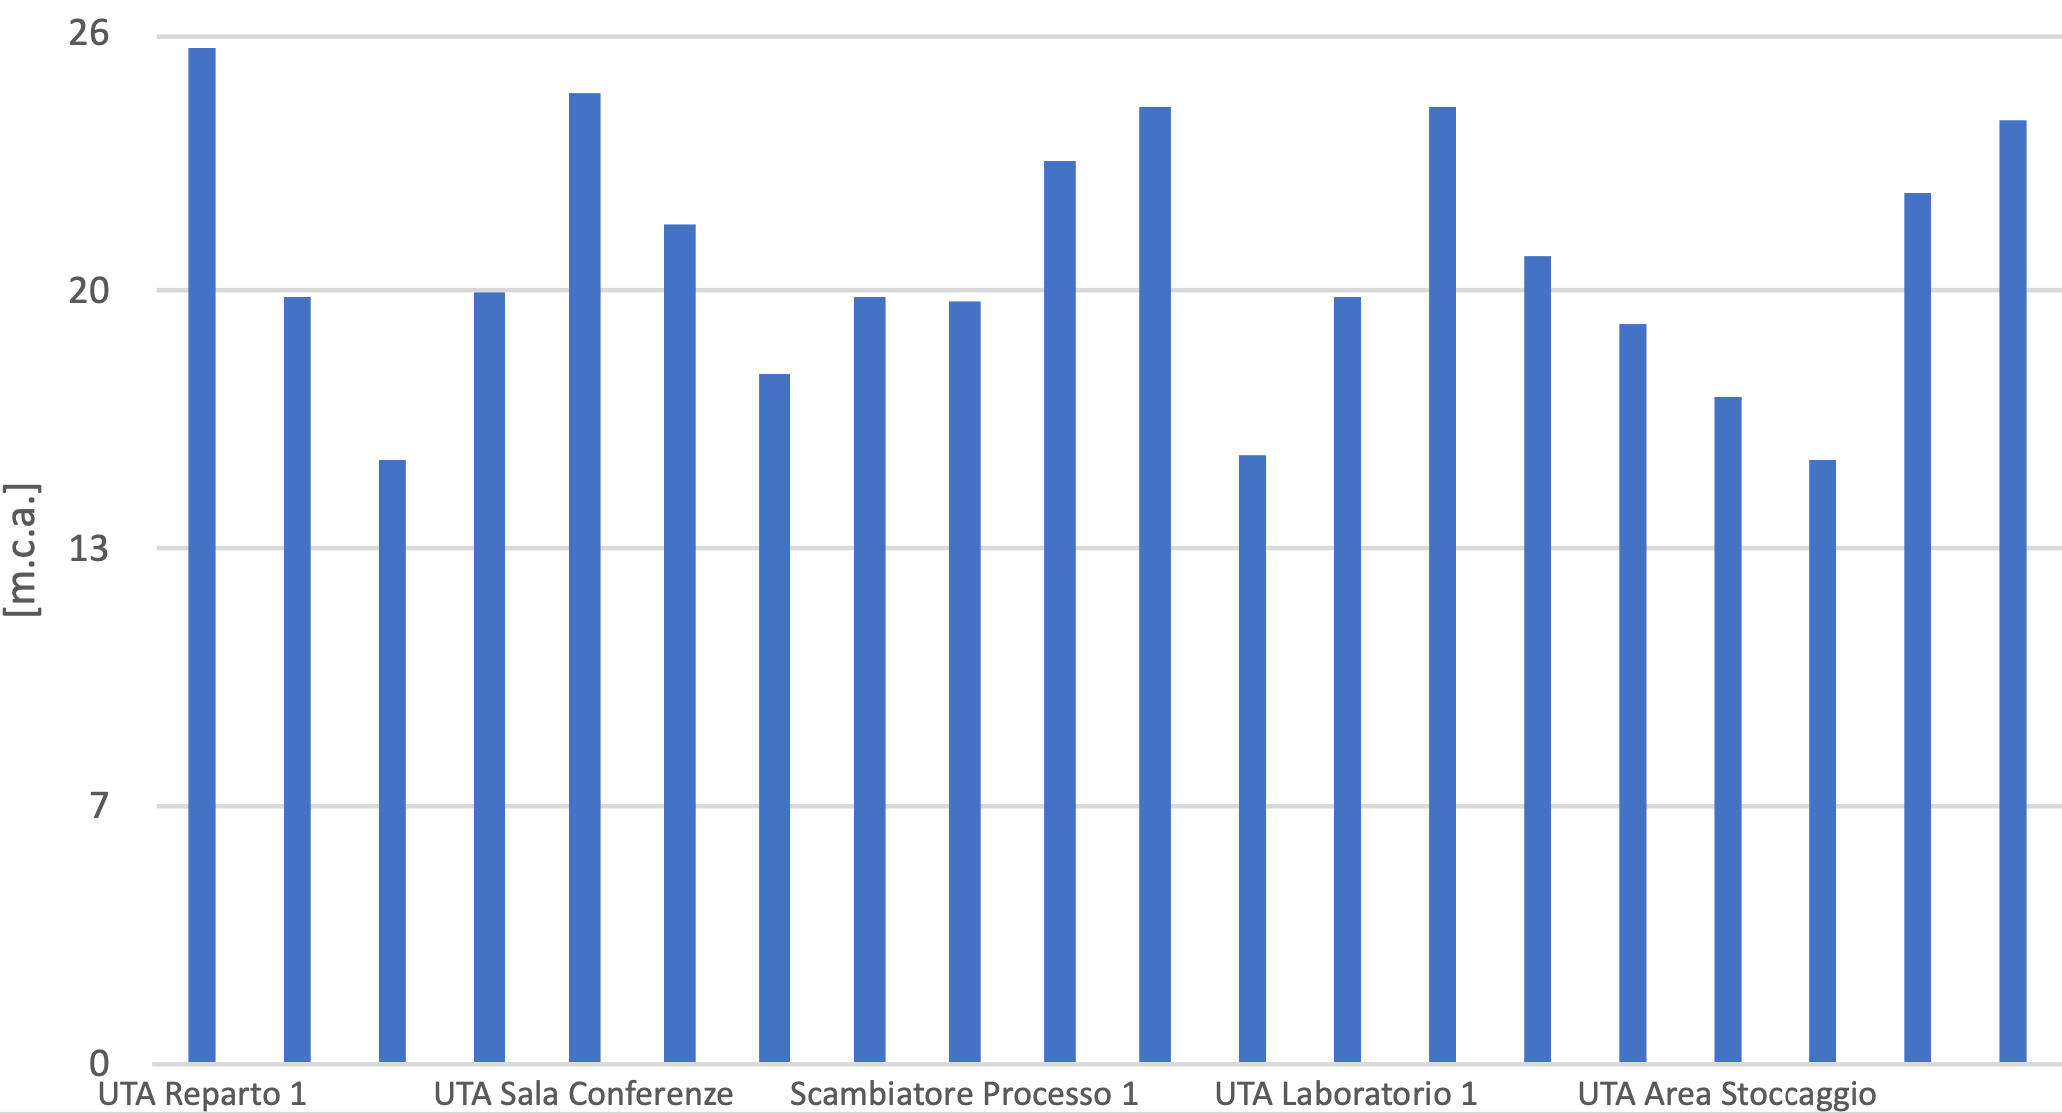
Chart 2. Comparison of actual flow rate and required flow rate
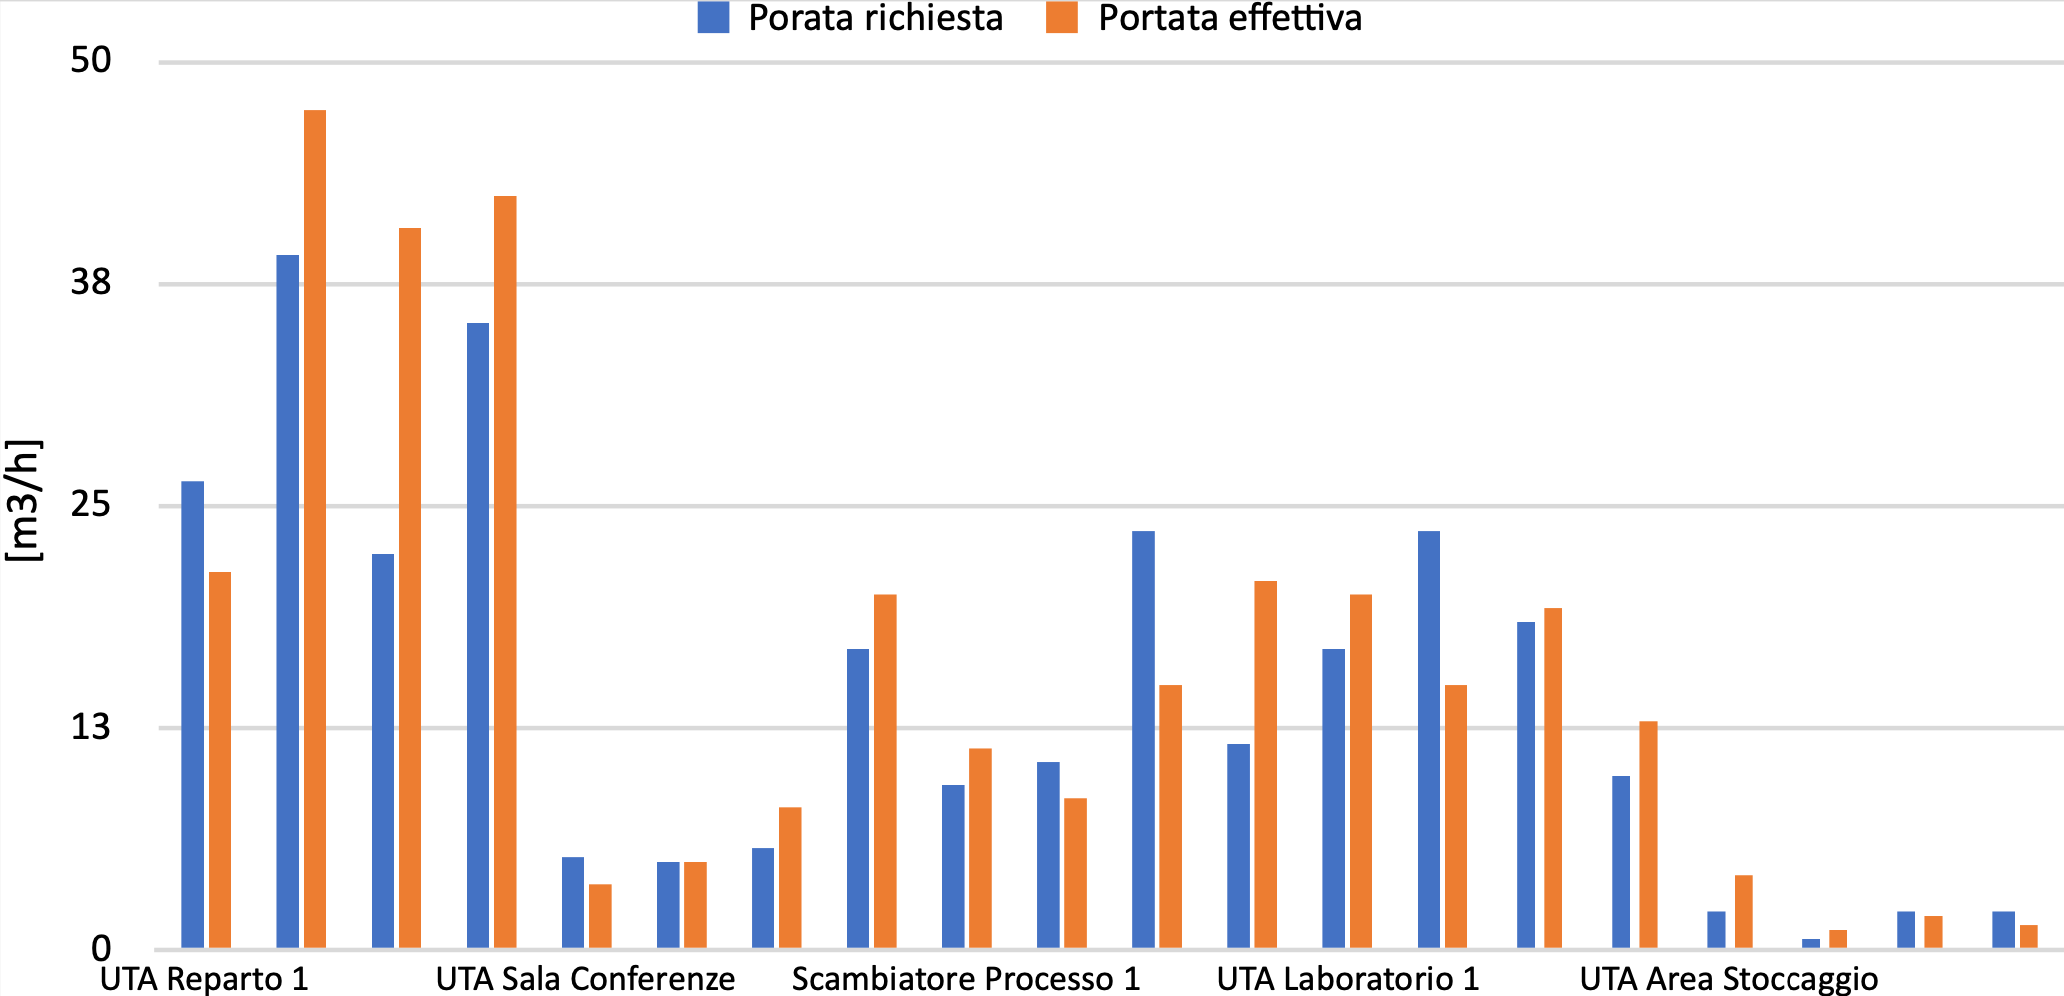
Chart 3. Temperature difference straddling utilities